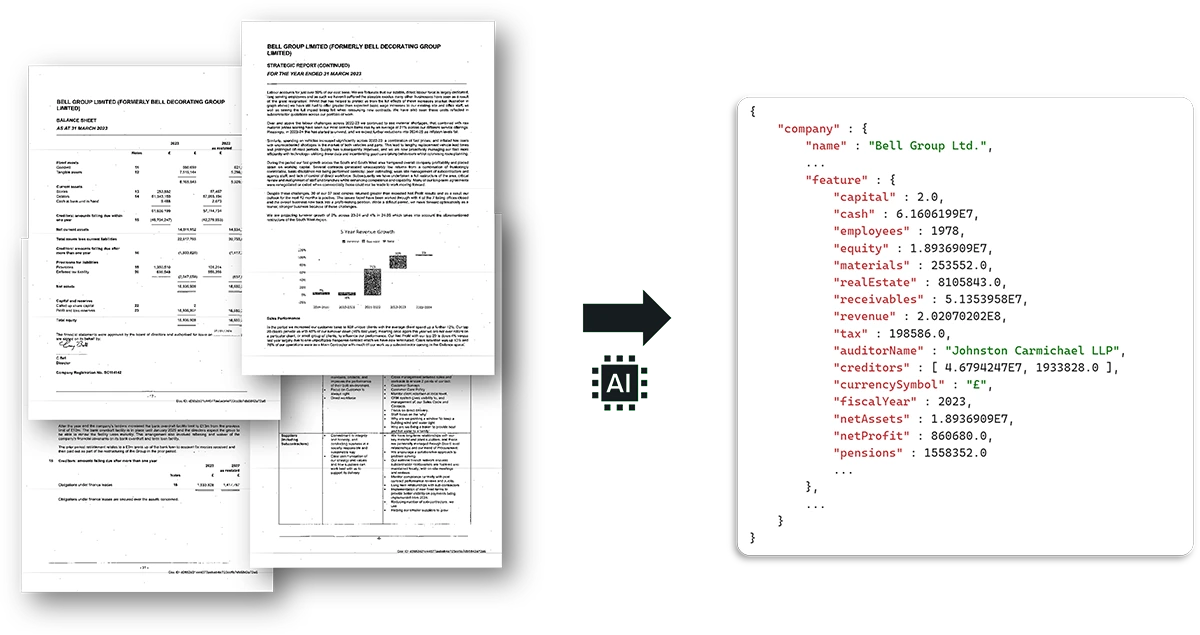
Welcome back to our series on analysing annual reports with AI. In Part One we showed how the extraction of key figures from annual reports with LLMs (such as ChatGPT) works. Now we are going deeper and showing the final working solution, which we are using in cooperation with North Data.
We have already demonstrated how relevant information can be filtered out of the dense text of annual reports in a structured way. But if you want to scale this process in practice, you quickly reach its limits – be it in terms of accuracy across many different documents, the robust processing of complex layouts and tables, or the cost-effectiveness of large-scale analysis.
This is exactly where there have been many exciting developments. With Gemini Flash from Google, a model is available which reshuffles the cards for automated document analysis in terms of speed, contextual understanding, and the delivery of structured data.1 In this second part, we will ask: what makes Gemini Flash so more powerful for this specific task than previous approaches or the classic OCR pipelines? How does it make the step from feasibility study to productive tool? Let us look under the hood.
The classic approach: OCR as the basis, but not the whole solution
Before we dive into Gemini’s capabilities, it is worth looking at the traditional way of extracting data from PDFs. This most commonly starts with Optical Character Recognition (OCR). OCR tools generate text from scanned documents or image-only PDFs by converting pixels into letters. The result is not only the raw text content, but often also its position on the page, usually in the form of coordinates or so-called bounding boxes for each recognized word or line.
However, for a meaningful analysis we need structured data, not continuous text. This is where the challenges begin.
The first hurdle lays in the structure in the pure text output being recognized. How do you automatically identify tables, related key-value pairs (such as “revenue: €10 million”) or semantically meaningful blocks? This often requires complex, downstream steps – whether purpose-built parsers, rule-based systems that look for specific patterns, or even separate machine learning models trained on tasks such as table recognition.
However, these downstream systems are often susceptible to layout changes. Small adjustments in the design of a report from one year to the next or the format differing between companies can throw off painstakingly created rules or parsers and make them unusable.
In addition, there is a lack of contextual understanding. OCR provides the text but does not understand its meaning. Recognizing that the term “Total Assets” on page 10 refers to the same metric as a detailed breakdown in a table on page 45 is beyond the capabilities of pure text recognition.
All these factors create complexity and thus lead to a high development and maintenance effort. It can be said that OCR is a valuable tool, but for the extraction of structured data it is usually only the first step in a complex and often fragile processing chain.
Our path to productive use: evaluation, model selection and integration
The leap from successful demonstration (as shown in Part 12) to a reliable, scalable production system required a systematic approach and further developments in several areas.
Firstly, a solid evaluation was essential. To this end we manually curated a dataset of 100 representative English annual reports. For the most important key figures, the correct values (ground truth) were annotated by hand and collected in a table. Only with such a reliable basis can the quality of different models and approaches be objectively measured and tracked over time.
Secondly, we significantly expanded the scope of extraction. Instead of just a few key figures, the goal was now to reliably extract a wide range of over 20 relevant values per report. This includes, among other things, the wage costs, information on profit and loss, cash flow, but also data such as the average number of employees or the name of the auditor.
These more demanding goals led us to test different models. In the end, the choice fell on Gemini 2.0 Flash Lite: This model optimally combined all the decisive factors for our application.
Quality & Speed: In our tests, Gemini 2.0 Flash Lite showed high accuracy for most of the targeted metrics, often keeping up with that of larger, more expensive models. Google itself positions the Flash models as optimized for tasks where it is important to maintain high speed and efficiency while maintaining high quality 3. Our experience confirms that the model lives up to its “flash” in its name in terms of processing speed.
Cost: A decisive factor for large-scale deployment is cost. Gemini 2.0 Flash Lite is significantly cheaper than the larger Pro models. Compared to older models like gpt-3.5-turbo-16k, which still cost about $3 per million input tokens in July 2023 4, the Gemini Flash variant we used is cheaper by a factor of 40 5! This makes the processing of thousands of reports economically viable.
Multimodality & Context: A significant advantage over plain text models or classic OCR pipelines is Gemini’s multimodality. Put simply, instead of just delivering the raw text and its coordinates (like traditional OCR), Gemini Flash can “read” the text and “see” the page layout at the same time. It “understands” how text is arranged in columns or tables, recognizes headings, and can interpret images or charts in the document. As a result, it is better at capturing context which the pure text order often does not convey. This is a great advantage, especially with the complex and varied layouts of annual reports. Coupled with the long context window, which allows the analysis of large document sections in one go, this is a decisive step forward.
This combination of good quality, high speed, low cost, and the ability to understand documents holistically made Gemini 2.0 Flash Lite a viable choice for our productive deployment in collaboration with North Data.
Gemini Flash in Action: The Workflow with Structured Outputs
The core of our approach combines the strengths of Gemini with pragmatic solutions to deal with the peculiarities of large documents.
A central problem with annual reports is that they often comprise hundreds of pages. While handing over the entire document to Gemini would be ideal for context, it is too expensive for mass use. To get around this problem, we have developed a multi-step approach: First, we still rely on proven OCR technology to extract the plain text of the entire document. This raw text then serves as the basis for a quick preliminary analysis using keywords. We look for terms and phrases that typically indicate relevant sections, such as “Consolidated Balance Sheet”, “Income Statement” or “Notes to the Financial Statements”.
Based on this analysis we then select the up to 100 pages that are most likely to contain the financial ratios we are looking for. Only this selection is then passed on to Gemini Flash Lite as a PDF context. This trick not only significantly reduces processing costs but also helps to focus the model on the important parts of the document and minimize the “noise” of irrelevant pages.
After isolating the relevant pages, we commission Gemini to extract them into a predefined format. Another building block for precise results is the use of so-called structured outputs. Gemini can not only generate text but also provides directly structured JSON data which follows a predetermined scheme.
To do this, we define a clear target scheme in advance, which in turn defines exactly which data fields we expect and in which format (such as “number”, “text”, “currency symbol”). In Python, we like to use Pydantic for easy definition and validation. We explicitly give this structure to the model as an instruction. This is not only practical for automated further processing, but also demonstrably improves quality: In our tests, this step alone led to an improvement in the evaluation result of around 4%.
Here is a simplified Python example to illustrate the principle with the google-genai library and structured outputs:
from google import genai
from google.genai import types
from pydantic import BaseModel, Field


client = genai.Client(api_key="GEMINI_API_KEY")


# Define the desired output structure using Pydantic
class FinancialData(BaseModel):
    revenue: float | None = Field(
        description="Total revenue reported for the fiscal year."
    )
    net_income: float | None = Field(description="Net income or profit after tax.")
    total_assets: float | None = Field(description="Total assets value.")
    fiscal_year: int | None = Field(description="The ending year of the fiscal period.")
    currency_symbol: str | None = Field(
        description="Currency symbol used for major values (e.g., $, £, €)."
    )


# Upload the relevant PDF pages (assuming 'selected_report_pages.pdf' was created by pre-filtering)
pdf_file = client.files.upload(file="'selected_report_pages.pdf")

prompt = """
Please analyze the provided pages from the annual report PDF.
Extract the following financial figures for the main consolidated entity reported:
- Total Revenue
- Net Income (Profit after tax)
- Total Assets
- The Fiscal Year End
- The primary Currency Symbol used for the main financial figures (£, $, € etc.)

Return the data strictly adhering to the provided 'FinancialData' schema.
If a value cannot be found or determined confidently, leave the corresponding field null.
Pay close attention to units (e.g., thousands, millions).
"""

try:
    response = client.models.generate_content(
        model="gemini-2.0-flash-lite-001",
        contents=[prompt, pdf_file],
        config=types.GenerateContentConfig(
            response_mime_type="application/json",
            response_schema=FinancialData,
        ),
    )
    extracted_data = FinancialData.model_validate_json(response.text)
    print(extracted_data)

except Exception as e:
    print(f"\nAn error occurred: {e}")

finally:
    client.files.delete(name=pdf_file.name)
A look at the numbers: How well does it really work?
To objectively assess the actual performance of our approach with Gemini Flash, we created a dataset of 100 manually annotated business reports. This serves as ground truth against which we check the extraction results of the model.
The overall accuracy across all metrics and reports for our approach was 83.5%. These were the first feasibility values for the solution we integrated at North Data. This is a solid basis which demonstrates that the approach works. However, it gets more interesting when you look at the accuracy for individual metrics:
| Key figure (parameters) | Accuracy |
|---|---|
| Overall | 83.5% |
| capital | 96.0% |
| cash | 95.0% |
| employees | 95.0% |
| revenue | 95.0% |
| equity | 98.0% |
| currencySymbol | 99.0% |
| auditorName | 89.0% |
| materials | 89.0% |
| … | … |
| liabilities (creditors) | 75.0% |
| currentAssets | 64.0% |
| realEstate | 60.0% |
| receivables | 52.0% |
| tax | 41.0% |
What does this table tell us and what are the current hurdles?
The results paint a clear picture: The model achieves remarkably high accuracy values for clearly defined master data or values, which are often prominently and relatively uniformly shown in annual reports. These include, for example, capital, equity, employees, cash or the currency symbol. Fortunately, hallucinations – for example inventing numbers that do not exist in the document – were not a significant problem in our tests. If errors occurred, it was usually due to misinterpretations of existing figures and not to their free invention.
It becomes more difficult for the model with more complex key figures. This is where the limitations of the current approach become apparent, especially when it comes to semantic fuzziness and varying levels of detail. Many balance sheet items can be defined, named, or broken down differently in reports. Terms such as “total assets” are not always clear – does it mean the balance sheet total before or after deduction of certain items such as goodwill, for example the intangible value?
The exact definition of current assets, receivables or liabilities varies between companies and reporting standards. This is where the model sometimes reaches its limits in deducing the exact definition valid in the respective report from the immediate context alone.
The dependence on layouts and the placement of information also plays a role. Some assets, such as realEstate (real estate assets), are often not prominently found on the main pages of the balance sheet but are hidden in detail in the “Notes to the Financial Statements” (Appendix). The model’s ability to correctly map such information across different pages and layouts is heavily challenged and results in lower accuracy scores.
Finally, some metrics require more complex interpretations or implicit calculations. The extraction of values such as tax is a good example of this. Different types of taxes (income taxes, sales taxes, etc.) and deferred taxes can often be spread over several sections. The correct aggregation and interpretation of this information is challenging, which explains the current accuracy of only 41% for this metric.
These quantitative results confirm our qualitative observations: the model is excellent at finding clearly labelled information. However, it reaches its limits when dealing with issues such as ambiguities in wording, widely varying or complex layouts, and the need to understand implicit knowledge or contexts across multiple text passages.
Another important aspect is the varying accuracy between different companies. The standard deviation of accuracy per company is about 9.2%. It is particularly striking that the accuracy of the large, individually designed reports from listed companies (PLCs) such as AstraZeneca (50%), Barclays (65%), HSBC (50%), Shell (70%) or Unilever (55%) tends to be significantly lower than average. Tests with excerpts of different lengths showed that the length of the context to be mastered is not a major difficulty for Gemini, we therefore assume that the uniqueness of the reporting structures of these groups is particularly challenging for the model. While Gemini Flash Lite handles layouts that are often created by smaller companies using off-the-shelf software, these complex cases are a bigger hurdle. One explanation could be that the reports that deviate from the standard rarely made it into Gemini’s training data.
Another recurring problem is the correct capture of units and scales. Missing or misinterpreting information such as “in thousands of £” or “millions of USD” will result in extracted values that are wrong by factors of 1,000 or 1,000,000. Here, robust downstream validation rules and targeted prompting are necessary to sensitize the model to these details.
The representation of negative numbers, which is often done by parentheses in annual reports (e.g. “(1.234)” instead of “-1.234”), also requires an explicit note in the prompt so that the model interprets this convention correctly and extracts the numbers with the correct sign. As already mentioned, hallucinations do not pose any major problems here (as it was with older models), it is the interpretation of the numbers that does not always succeed.
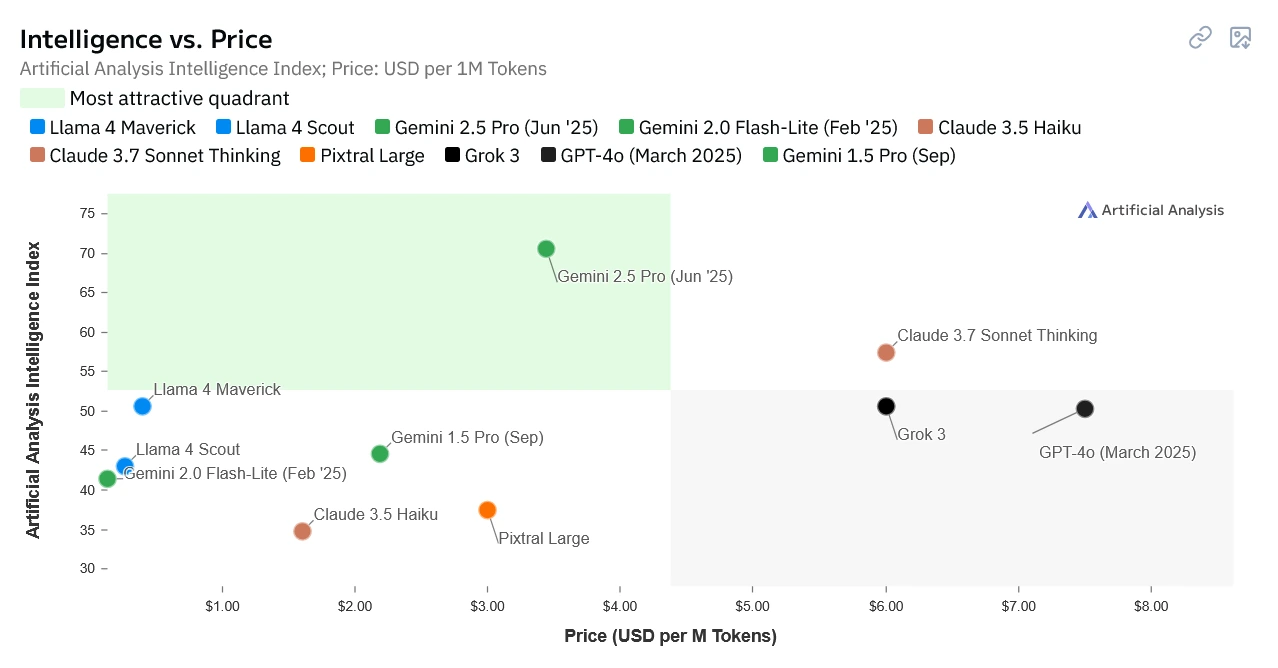
Finally, we are also faced with the classic trade-off between costs and performance in particularly complex cases. More sophisticated reasoning approaches such as Chain-of-Thought (CoT), in which the model makes its “thought steps” explicit, or the use of even larger and more powerful models (for example Gemini 2.5 Pro) could remedy the problems mentioned, especially when analysing the more complex reports.
However, these are currently often much more expensive. For example, Gemini 2.5 Pro is currently 16 to 32 times more expensive than the Gemini 2.0 Flash Lite we used. The common GPT-4.1, which is used in ChatGPT, also costs $2 per 1 million input tokens – about 27 times as much as Gemini 2.0 Flash Lite. Using our solution to process an average report from our 30-page test dataset costs only about $0.0007!
Conclusion: Gemini Flash as a powerful addition to the toolbox
Gemini Flash has proven to be a useful building block for us to take the extraction of structured data from annual reports to a new level and bring it into productive use at North Data. It does not necessarily replace the entire classic pipeline (as our OCR pre-filtering shows), but it does provide a powerful, integrated alternative to the core process of intelligent data extraction and structuring.
The ability to understand layouts, work within a larger context, and deliver structured outputs significantly reduces complexity and maintenance compared to traditional, multi-tiered approaches. The challenges remain, but the progress is clear and opens new opportunities for automated financial data analysis.
We are excited to see how this technology will develop further and what new solutions will emerge. Have you had similar experiences or developed different strategies? Share your thoughts with us!
This blog post was written with the support of Gemini 2.5 Pro.
-
OmniAI OCR Benchmark, retrieved 17/06/25 ↩
-
cronn Blog: Analyzing Business Reports with ChatGPT – Part I ↩
-
Documentation Google Gemini 2.0 Flash-Lite, retrieved 17/06/25 ↩
-
Web Archive: OpenAI-Preise vom 14. Juni 2023, retrieved 17/06/25 ↩
-
Prices for Gemini Developer API, retrieved 17/06/25 ↩